
Hello,
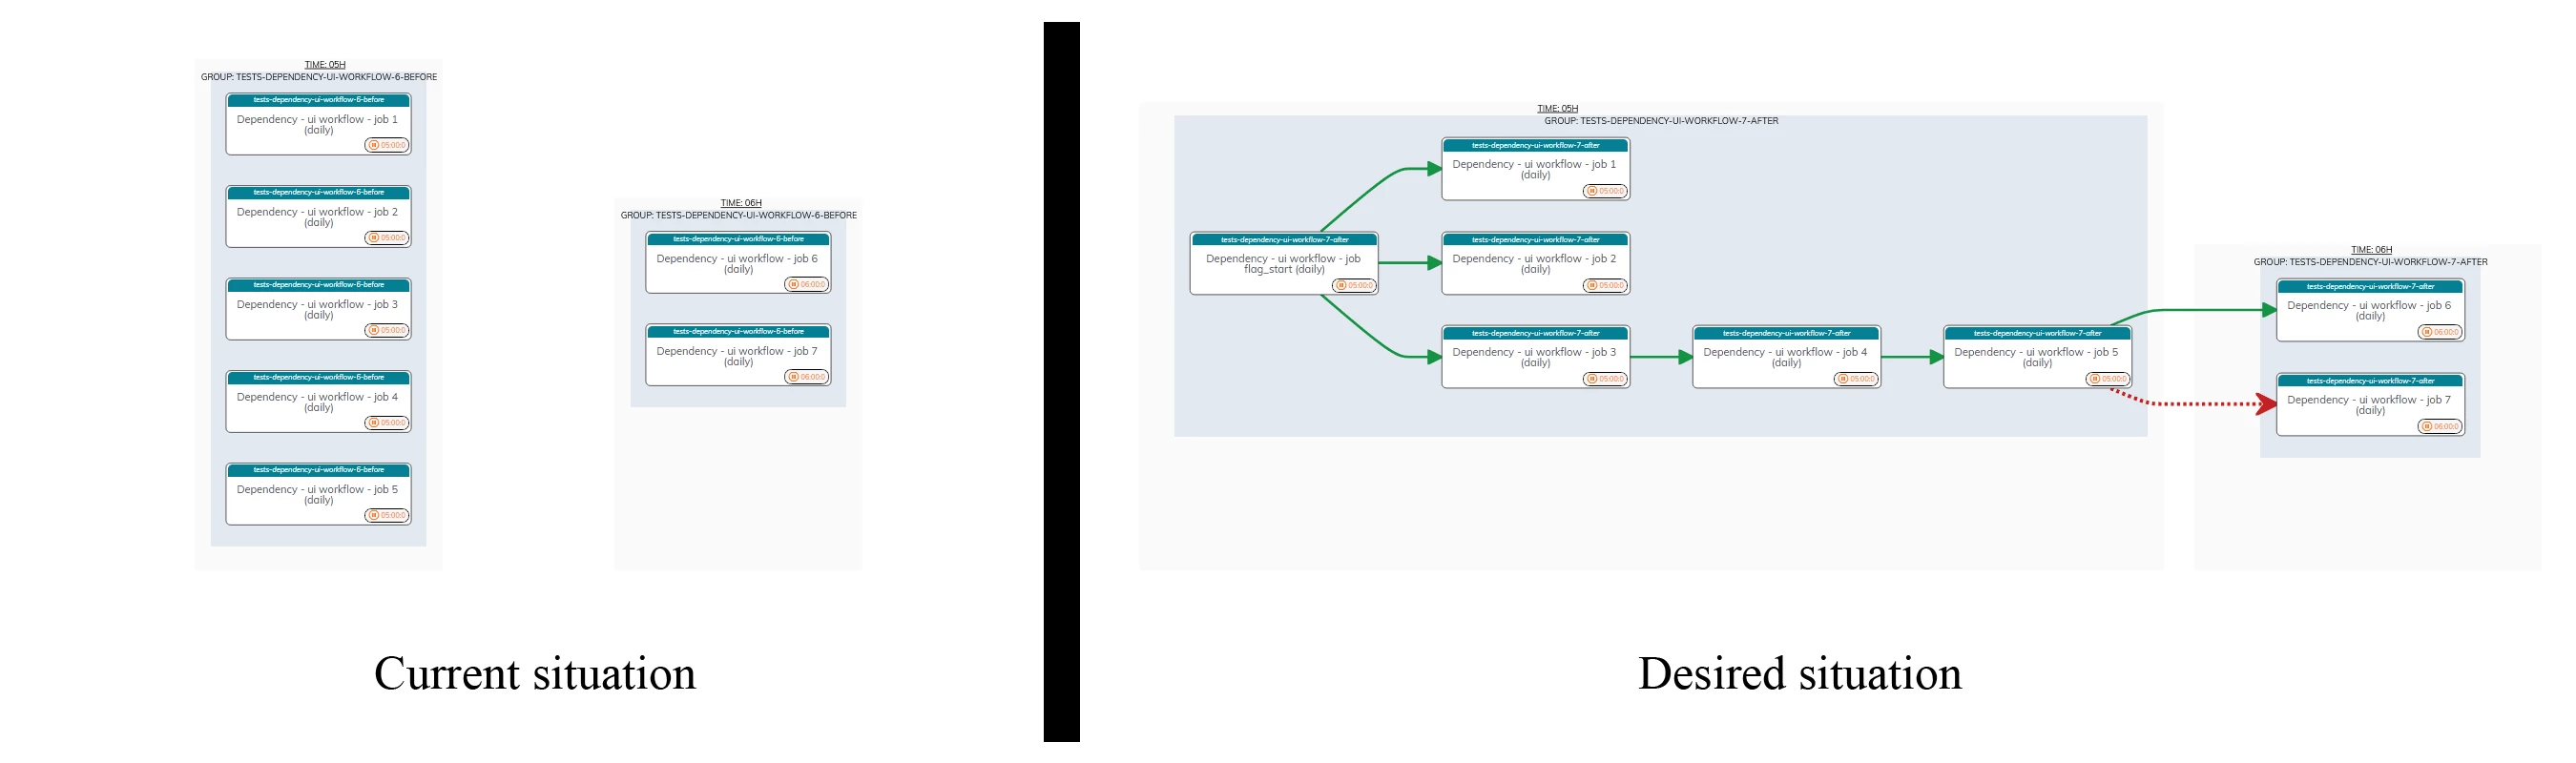
I introduced some times ago a workflow plugin, allowing to create dependency links between jobs that can subsist over the 24h duration of the workflow, which is defined with a daily basis.
This can lead, for example, with a job failing for any reason, and the jobs linked to it waiting patiently until the error is fixed, and relaunched. If needed, waiting for the whole night.
Since, I’ve worked on tackling the main problem due to linking dozen of jobs together : a visual representation of the jobs and the links between them, through a new UI plugin.
Preferably, with an interactive output and able to be updated at will.
I’ve reached a satisfactory level with it, where while the desired goal is reached, the UI plugin became more than useful even for people not using the other dependencies modules.
To the point it is becoming a companion of the main UI.
The github repo is available here, with the usage documentation.
As the new module in the plugin is mostly on the browser side, the installation is not more than a drag and drop through the plugin installation panel of Rundeck.
It is then accessible under any project, on the job window.
The plugin is limited to read-only access, it is not designed to allow any modification.
Some screenshots :
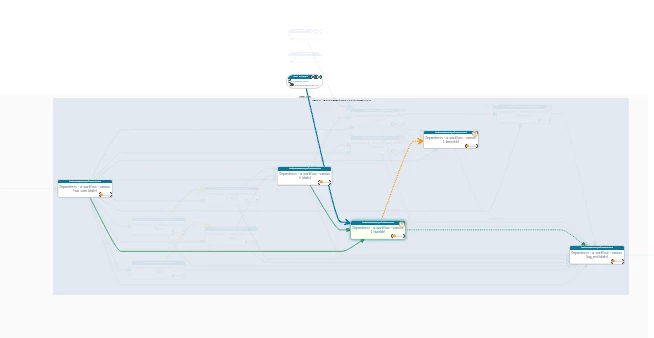
Excerpt of the general UI
Some of the information available on each jobs
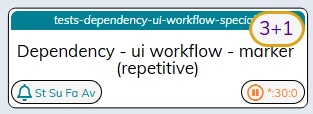
The most helpful are the short presentation of the schedule in the lower right, with different colors depending of the state (enable, unscheduled, disabled).
The full schedule definition is present as a tooltip.
On the left are the active notifications
The job name is a link to the job definition itself, opened in a new window.
A focus mode is available to enhance the visibility
And reducing the clutter with many dependencies links active.
Available when clicking on the header / title of a job.
Some things to know :
- The plugin is still in beta.
While it is already in a good place, some things need to be tuned and / or revisited, like the 2 different ways to present the tooltips (directly on the item or at the bottom of the panel).
- The performance is surprisingly good, I did some tests with ~200 jobs and 2 to 4 links per jobs. Still, it can take up to 10 secs to render the interactive diagram.
- The jobs are ordered first by their hourly schedules, then per their own groups.
It is to give a presentation close to the execution of the workflow.
Jobs without a schedule are labeled as “manual”, and grouped first, then followed by jobs with a repetitive schedule
- All information printed in the markers on the jobs have a tooltip with a description.
Same for the links between jobs
- Each job information must be supported by the plugin to show a marker.
For now, aside the dependencies modules, obviously, the plugins “job state conditional” and “job reference” are supported. Other plugins will follow.
- Referenced jobs from other projects are presented with a specific marker, but limited information. This is on purpose, for performance reason.
- The DagreJs library used for the calculation and automatic placement has a tendency to stack the job nodes in columns. This also explains why the groups area can have a large empty space.
I cannot do much about this behavior, many settings are simply not implemented.