Hi PagerDuty team! 👋
I'm trying to get custom details from Grafana alerts to display in our Slack notifications, but only seeing basic information.
Current Setup:
- ✅ Grafana → PagerDuty integration working (using Events API V2)
- ✅ PagerDuty → Slack integration connected (service:
my-service-prod→ channel:#team-alerts) - ✅ Alerts are flowing through successfully
The Issue: Our Grafana alerts send rich custom details to PagerDuty (verified in PagerDuty incident view):
- severity: "critical"
- namespace: "production"
- pod: "api-service-7d9c5-xyz"
- cluster: "us-west-2-prod"
- component: "api-service"
- description: "Pod is in CrashLoopBackOff state..."
- runbook_url: "https://wiki.internal/runbooks/..."
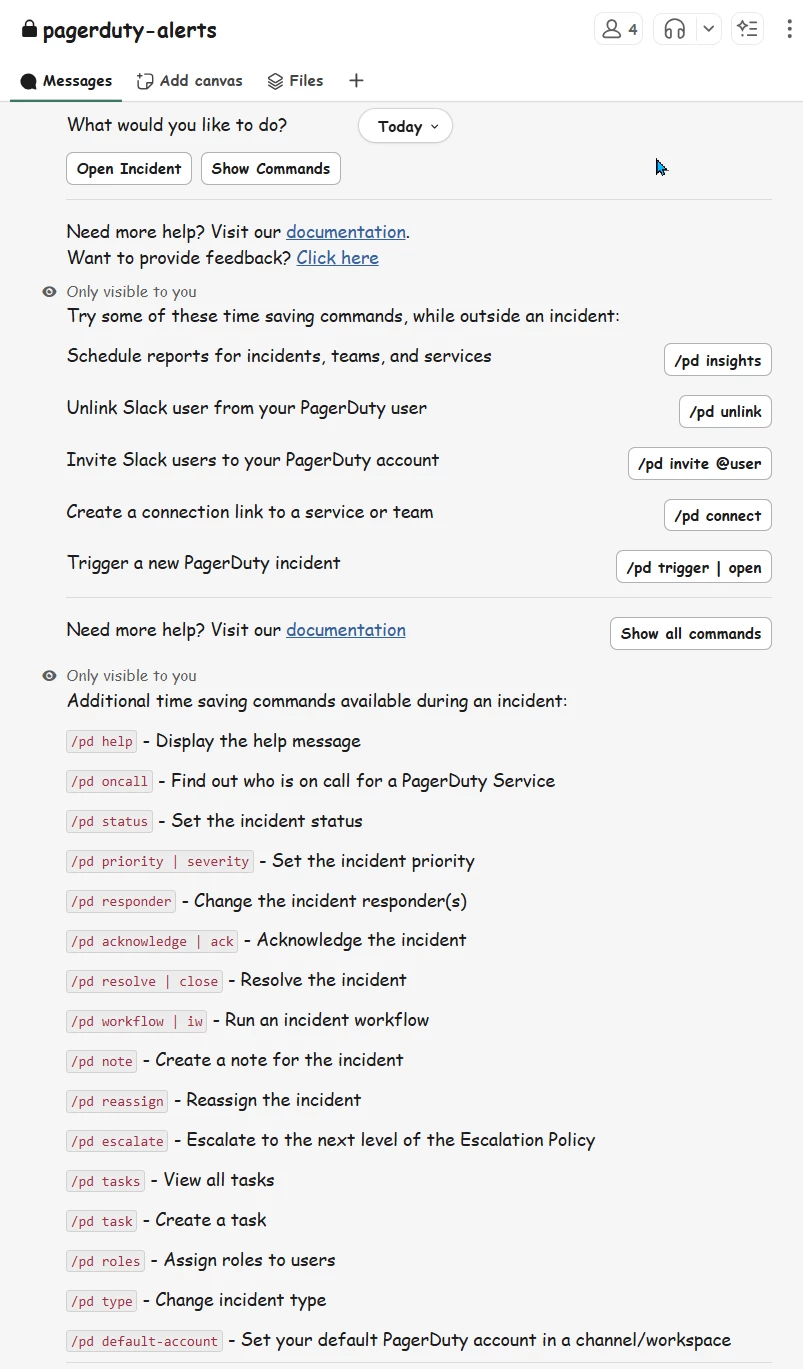
However, in Slack we only see:
🔴 Pod CrashLoopBackOff Alert
Service: my-service-prod
Urgency: Low
[Acknowledge] [Resolve]
What We Need: Display the custom_details fields in Slack notifications so our on-call engineers can see critical context without clicking through to PagerDuty.
What I've Tried:
- Configured PagerDuty contact point in Grafana with Details fields mapped to templates like
{{ .CommonLabels.namespace }} - Checked Slack integration settings in PagerDuty (Extensions → Slack → View)
- The configuration UI only shows basic options (thread creation, channel selection) but no options for enabling custom details display
Questions:
- Is there a way to enable custom details display in the current Slack integration?
- Do we need to upgrade to a different Slack integration version or add Slack V2 app?
- Can Event Orchestration be used to enrich Slack messages with custom_details?
- Is there an API endpoint or webhook approach for more control over Slack message formatting?
Environment: Using standard PagerDuty Slack integration Service: my-service-prod Integration Key: Events API V2
Any guidance would be greatly appreciated! Looking to display the custom metadata our monitoring system sends to help reduce MTTR. 🙏

