
I am unable to see this in the analytics page, I am a global admin, and not sure what is preventing access to this type of report.
I am unable to see this in the analytics page, I am a global admin, and not sure what is preventing access to this type of report.
Best answer by jcalc
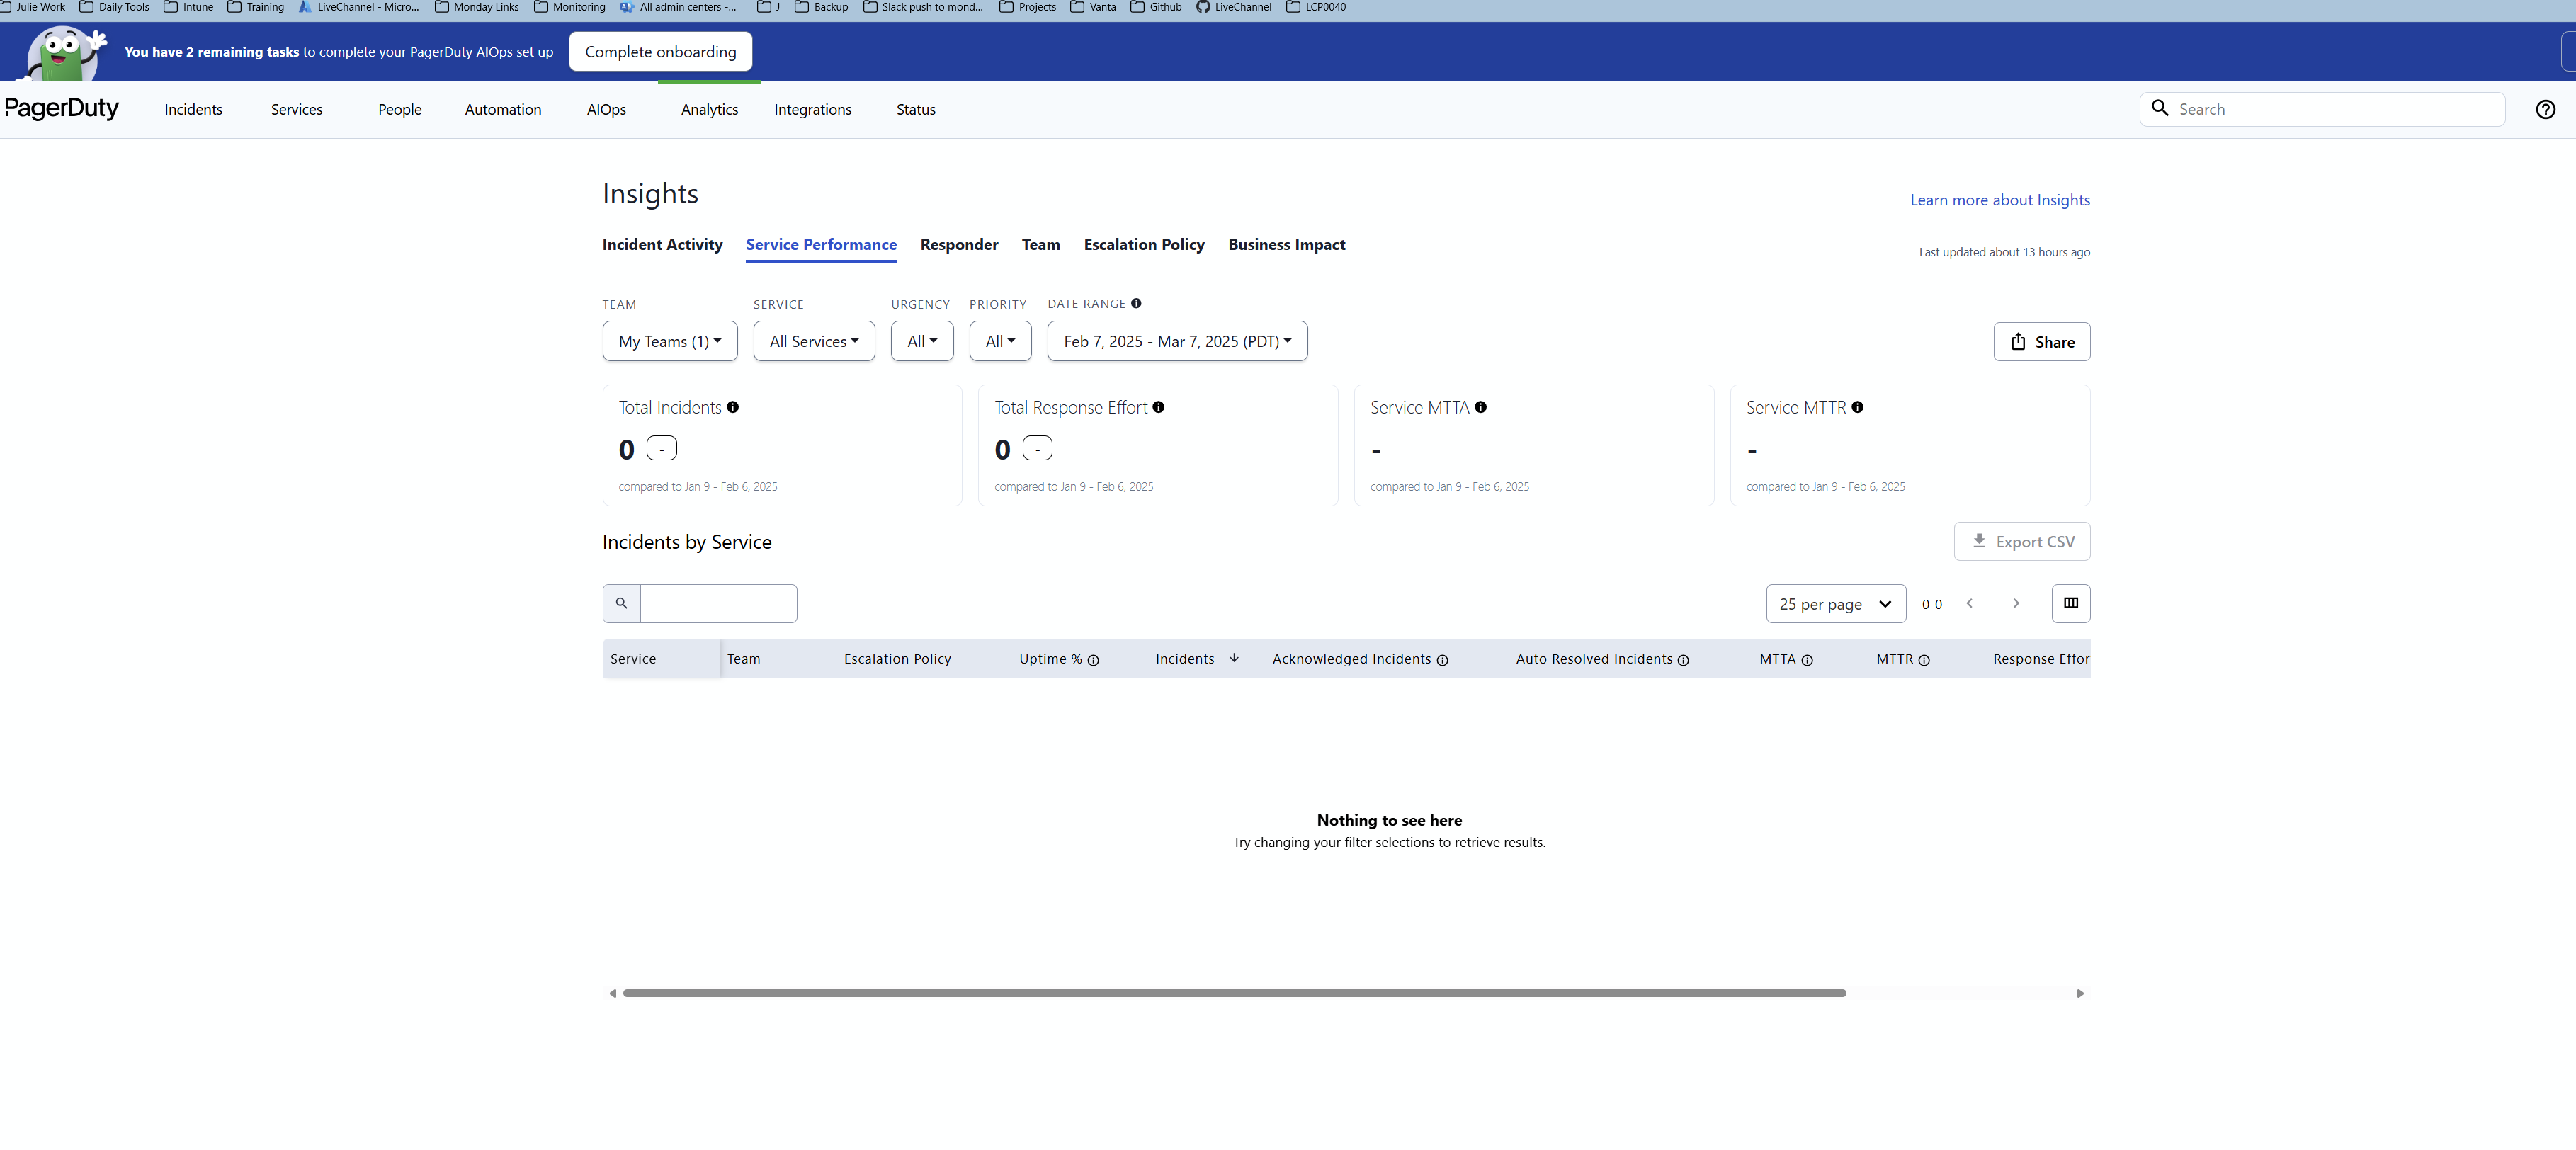
Likely your “team” selection doesn’t have a service where incidents showed up in that time period.
Remove all the filters and you should see all incidents
No account yet? Create an account
Enter your E-mail address. We'll send you an e-mail with instructions to reset your password.